We recognise that we have a role to play in tackling environmental degradation and climate change. We do this through providing products and services that reduce our customers’ environmental impact and by the active management and mitigation of the impact of our own operations.
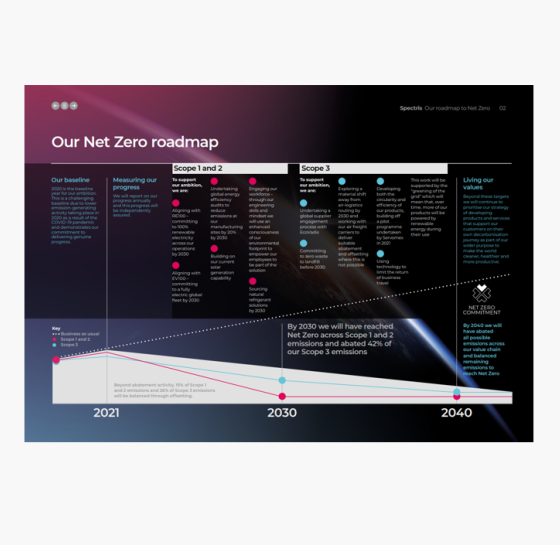
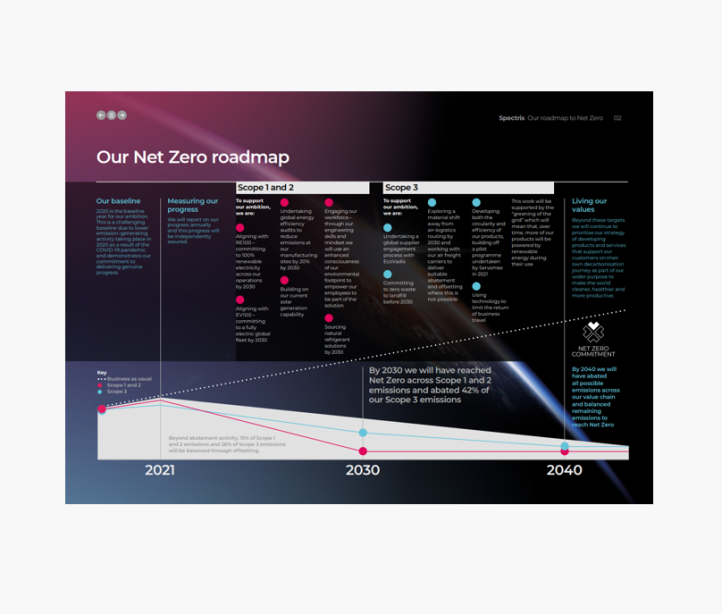
Our Net Zero ambition is at the heart of our sustainability strategy. We have set a clear ambition:
Spectris operations:
Net Zero by 2030 (Scope 1 and 2 emissions)
Our value chain:
Net Zero by 2040 (Scope 3 emissions)
Our science-based targets support this ambition:
- The 85% absolute reduction in Scope 1 and 2 emissions by 2030
- The 42% absolute reduction in Scope 3 emissions by 2030
- Both targets are aligned to a 1.5 degree warming scenario and have been validated by the Science Based Targets initiative.
Spectris has not paid any significant fines (> USD10,000) related to environmental or ecological issues in the past four fiscal years.

Our Net Zero Roadmap
This document sets out our roadmap, explaining how we will achieve our ambition. We will be transparent on our progress and we have clear structures to ensure accountability and support our ability to measure our progress and deliver against these ambitious goals.